Front Foot:38.6%
Back Foot:57.2%
Front Foot:5.8%
Back Foot:96.8%
Front Foot:83.9%
Back Foot:11.1%
Three different walking behaviors for a half-cheetah agent. Each behavior differs in how often each of the half-cheetah's feet contacts the ground. All behaviors were generated by one run of a quality diversity algorithm. In our work, we develop two new quality diversity algorithms and compare them with existing methods.

Approximating Gradients for Differentiable Quality Diversity in Reinforcement Learning

Bryon Tjanaka
University of Southern California
tjanaka@usc.edu

Matthew C. Fontaine
University of Southern California
mfontain@usc.edu

Julian Togelius
New York University
julian@togelius.com

Stefanos Nikolaidis
University of Southern California
nikolaid@usc.edu

Abstract

Consider the problem of training robustly capable agents. One approach is to generate a diverse collection of agent polices. Training can then be viewed as a quality diversity (QD) optimization problem, where we search for a collection of performant policies that are diverse with respect to quantified behavior. Recent work shows that differentiable quality diversity (DQD) algorithms greatly accelerate QD optimization when exact gradients are available. However, agent policies typically assume that the environment is not differentiable. To apply DQD algorithms to training agent policies, we must approximate gradients for performance and behavior. We propose two variants of the current state-of-the-art DQD algorithm that compute gradients via approximation methods common in reinforcement learning (RL). We evaluate our approach on four simulated locomotion tasks. One variant achieves results comparable to the current state-of-the-art in combining QD and RL, while the other performs comparably in two locomotion tasks. These results provide insight into the limitations of current DQD algorithms in domains where gradients must be approximated. Source code is available at https://github.com/icaros-usc/dqd-rl

1 Introduction

Diagram of CMA-MEGA (ES) and CMA-MEGA (TD3, ES). Refer to caption.
Figure 1: We develop two RL variants of the CMA-MEGA algorithm. Similar to CMA-MEGA, the variants sample gradient coefficients c{\bm{c}} and branch around a solution point ϕ{\bm{\phi}}^{*}. We evaluate each branched solution ϕi{\bm{\phi}}^{\prime}_{i} as part of a policy πϕi\pi_{{\bm{\phi}}^{\prime}_{i}} and insert ϕi{\bm{\phi}}^{\prime}_{i} into the archive. We then update ϕ{\bm{\phi}}^{*} and N(μ,Σ)\mathcal{N}({\bm{\mu}},{\bm{\Sigma}}) to maximize archive improvement. Our RL variants differ from CMA-MEGA by approximating gradients with ES and TD3, since exact gradients are unavailable in RL settings.

We focus on the problem of extending differentiable quality diversity (DQD) to reinforcement learning (RL) domains. We propose to approximate gradients for the objective and measure functions, resulting in two variants of the DQD algorithm CMA-MEGA [18].

Consider a half-cheetah agent (Fig. 2) trained for locomotion, where the agent must continue walking forward even when one foot is damaged. If we frame this challenge as an RL problem, two approaches to design a robustly capable agent would be to (1) design a reward function and (2) apply domain randomization [58, 47]. However, prior work [29, 8] suggests that designing such a reward function is difficult, while domain randomization may require manually selecting hundreds of environment parameters [47, 44].

As an alternative approach, consider that we have intuition on what behaviors would be useful for adapting to damage. For instance, we can measure how often each foot is used during training, and we can pre-train a collection of policies that are diverse in how the agent uses its feet. When one of the agent’s feet is damaged during deployment, the agent can adapt to the damage by selecting a policy that did not move the damaged foot during training [13, 9].

Front Foot:5.8%
Back Foot:96.8%
Front Foot:83.9%
Back Foot:11.1%
Figure 2: A half-cheetah agent executing two walking policies. On the left, the agent walks on its back foot while tapping the ground with its front foot. On the right, the agent walks on its front foot while jerking its back foot. Values on each video show the percentage of time each foot contacts the ground (each foot is measured individually, so values do not sum to 100%). With these policies, the agent could continue walking even if one foot is damaged.

Pre-training such a collection of policies may be viewed as a quality diversity (QD) optimization problem [49, 13, 40, 9]. Formally, QD assumes an objective function ff and one or more measure functions m{\bm{m}}. The goal of QD is to find solutions satisfying all output combinations of m{\bm{m}}, i.e. moving different combinations of feet, while maximizing each solution’s ff, i.e. walking forward quickly. Most QD algorithms treat ff and m{\bm{m}} as black boxes, but recent work [18] proposes differentiable quality diversity (DQD), which assumes ff and m{\bm{m}} are differentiable functions with exact gradient information. QD algorithms have been applied to procedural content generation [25], robotics [13, 40], aerodynamic shape design [22], and scenario generation in human-robot interaction [20, 17].

The recently proposed DQD algorithm CMA-MEGA [18] outperforms QD algorithms by orders of magnitude when exact gradients are available, such as when searching the latent space of a generative model. However, RL problems like the half-cheetah lack these gradients because the environment is typically non-differentiable, thus limiting the applicability of DQD. To address this limitation, we draw inspiration from how evolution strategies (ES) [1, 60, 51, 39] and deep RL actor-critic methods [53, 54, 38, 21] optimize a reward objective by approximating gradients for gradient descent. Our key insight is to approximate objective and measure gradients for DQD algorithms by adapting ES and actor-critic methods.

Our work makes three contributions. (1) We formalize the problem of quality diversity for reinforcement learning (QD-RL) and reduce it to an instance of DQD. (2) We develop two QD-RL variants of the DQD algorithm CMA-MEGA, where each algorithm approximates objective and measure gradients with a different combination of ES and actor-critic methods. (3) We benchmark our variants on four PyBullet locomotion tasks from QDGym [15, 43]. One variant performs comparably (in terms of QD score; Sec. 5.1.3) to the state-of-the-art PGA-MAP-Elites [42] in two tasks. The other variant achieves comparable QD score with PGA-MAP-Elites in all tasks11 1 We note that the performance of the CMA-MEGA is worse than PGA-MAP-Elites in two of the tasks, albeit within variance. We consider it likely that additional runs would result in PGA-MAP-Elites performing significantly better in these tasks. We leave further evaluation for future work. but is less efficient than PGA-MAP-Elites in two tasks.

These results contrast with prior work [18] where CMA-MEGA vastly outperforms a DQD algorithm inspired by PGA-MAP-Elites on benchmark functions where gradient information is available. Overall, we shed light on the limitations of CMA-MEGA in QD domains where the main challenge comes from optimizing the objective rather than from exploring measure space. At the same time, since we decouple gradient estimates from QD optimization, our work opens a path for future research that would benefit from independent improvements to either DQD or RL.

2 Problem Statement

2.1 Quality Diversity (QD)

We adopt the definition of QD from prior work [18]. For a solution vector ϕRn{\bm{\phi}}\in\mathbb{R}^{n}, QD considers an objective function f(ϕ)f({\bm{\phi}}) and kk measures22 2 Prior work refers to measure function outputs as “behavior characteristics,” “behavior descriptors,” or “feature descriptors.” mi(ϕ)Rm_{i}({\bm{\phi}})\in\mathbb{R} (for i1..ki\in 1..k) or, as a joint measure, m(ϕ)Rk{\bm{m}}({\bm{\phi}})\in\mathbb{R}^{k}. These measures form a kk-dimensional measure space X\mathcal{X}. For every xX{\bm{x}}\in\mathcal{X}, the QD objective is to find solution ϕ{\bm{\phi}} such that m(ϕ)=x{\bm{m}}({\bm{\phi}})={\bm{x}} and f(ϕ)f({\bm{\phi}}) is maximized. Since X\mathcal{X} is continuous, it would require infinite memory to solve the QD problem, so algorithms in the MAP-Elites family [40, 13] discretize X\mathcal{X} by forming a tesselation Y\mathcal{Y} consisting of MM cells. Thus, we relax the QD problem to one of searching for an archive A\mathcal{A} consisting of MM elites ϕi{\bm{\phi}}_{i}, one for each cell in Y\mathcal{Y}. Then, the QD objective is to maximize the performance f(ϕi)f({\bm{\phi}}_{i}) of all elites:

maxϕ1..Mi=1Mf(ϕi)\displaystyle\max_{{\bm{\phi}}_{1..M}}\sum_{i=1}^{M}f({\bm{\phi}}_{i})(1)

2.1.1 Differentiable Quality Diversity (DQD)

In DQD, we assume ff and m{\bm{m}} are first-order differentiable. We denote the objective gradient as f(ϕ){\bm{\nabla}}f({\bm{\phi}}), or abbreviated as f{\bm{\nabla}}f, and the measure gradients as m(ϕ){\bm{\nabla}}{\bm{m}}({\bm{\phi}}) or m{\bm{\nabla}}{{\bm{m}}}.

2.2 Quality Diversity for Reinforcement Learning (QD-RL)

We define QD-RL as an instance of the QD problem in which each solution ϕ{\bm{\phi}} parameterizes an RL policy πϕ\pi_{\bm{\phi}}. Then, the objective f(ϕ)f({\bm{\phi}}) is the expected discounted return of πϕ\pi_{\bm{\phi}}, and the measures m(ϕ){\bm{m}}({\bm{\phi}}) are functions of πϕ\pi_{\bm{\phi}}. Formally, drawing on the Markov Decision Process (MDP) formulation [55], we represent QD-RL as a tuple (S,U,p,r,γ,m)(\mathcal{S},\mathcal{U},p,r,\gamma,{\bm{m}}). On discrete timesteps tt in an episode of interaction, an agent observes state sSs\in\mathcal{S} and takes action aUa\in\mathcal{U} according to a policy πϕ(as)\pi_{\bm{\phi}}(a|s). The agent then receives scalar reward r(s,a)r(s,a) and observes next state sSs^{\prime}\in\mathcal{S} according to sp(s,a)s^{\prime}\sim p(\cdot|s,a). Each episode thus has a trajectory ξ={s0,a0,s1,a1,..,sT}\xi=\{s_{0},a_{0},s_{1},a_{1},..,s_{T}\}, where TT is the number of timesteps in the episode, and the probability that policy πϕ\pi_{\bm{\phi}} takes trajectory ξ\xi is pϕ(ξ)=p(s0)t=0T1πϕ(atst)p_{\bm{\phi}}(\xi)=p(s_{0})\prod_{t=0}^{T-1}\pi_{\bm{\phi}}(a_{t}|s_{t}) p(st+1st,at)p(s_{t+1}|s_{t},a_{t}). Now, we define the expected discounted return of policy πϕ\pi_{\bm{\phi}} as

f(ϕ)=Eξpϕ[t=0Tγtr(st,at)]\displaystyle f({\bm{\phi}})=\mathbb{E}_{\xi\sim p_{\bm{\phi}}}\left[\sum_{t=0% }^{T}\gamma^{t}r(s_{t},a_{t})\right](2)

where the discount factor γ(0,1)\gamma\in(0,1) trades off between short- and long-term rewards. Finally, we quantify the behavior of policy πϕ\pi_{\bm{\phi}} via a kk-dimensional measure function m(ϕ){\bm{m}}({\bm{\phi}}).

2.2.1 QD-RL as an instance of DQD

We reduce QD-RL to a DQD problem. Since the exact gradients f{\bm{\nabla}}f and m{\bm{\nabla}}{\bm{m}} usually do not exist in QD-RL, we must instead approximate them.

3 Background

3.1 Single-Objective Reinforcement Learning

We review algorithms which train a policy to maximize a single objective, i.e. f(ϕ)f({\bm{\phi}}) in Eq. 2, with the goal of applying these algorithms’ gradient approximations to DQD in Sec. 4.

3.1.1 Evolution strategies (ES)

ES [4] is a class of evolutionary algorithms which optimizes the objective by sampling a population of solutions and moving the population towards areas of higher performance. Natural Evolution Strategies (NES) [60, 61] is a type of ES which updates the sampling distribution of solutions by taking steps on distribution parameters in the direction of the natural gradient [2]. For example, with a Gaussian sampling distribution, each iteration of an NES would compute natural gradients to update the mean μ{\bm{\mu}} and covariance Σ{\bm{\Sigma}}.

We consider an NES-inspired algorithm [51] which has demonstrated success in RL domains. This algorithm, which we refer to as OpenAI-ES, samples λes\lambda_{es} solutions from an isotropic Gaussian but only computes a gradient step for the mean ϕ{\bm{\phi}}. Each solution sampled by OpenAI-ES is represented as ϕ+σϵi{\bm{\phi}}+\sigma{\bm{\epsilon}}_{i}, where σ\sigma is the fixed standard deviation of the Gaussian and ϵiN(0,I){\bm{\epsilon}}_{i}\sim{\mathcal{N}}(\mathbf{0},{\bm{I}}). Once these solutions are evaluated, OpenAI-ES estimates the gradient as

f(ϕ)1λesσi=1λesf(ϕ+σϵi)ϵi\displaystyle{\bm{\nabla}}f({\bm{\phi}})\approx\frac{1}{\lambda_{es}\sigma}% \sum_{i=1}^{\lambda_{es}}f({\bm{\phi}}+\sigma{\bm{\epsilon}}_{i}){\bm{\epsilon% }}_{i}(3)

OpenAI-ES then passes this estimate to an Adam optimizer [32] which outputs a gradient ascent step for ϕ{\bm{\phi}}. To make the estimate more accurate, OpenAI-ES further includes techniques such as mirror sampling and rank normalization [5, 26, 60].

3.1.2 Actor-critic methods

While ES treats the objective as a black box, actor-critic methods leverage the MDP structure of the objective, i.e. the fact that f(ϕ)f({\bm{\phi}}) is a sum of Markovian values. We are most interested in Twin Delayed Deep Deterministic policy gradient (TD3) [21], an off-policy actor-critic method. TD3 maintains (1) an actor consisting of the policy πϕ\pi_{\bm{\phi}} and (2) a critic consisting of state-action value functions Qθ1(s,a)Q_{{\bm{\theta}}_{1}}(s,a) and Qθ2(s,a)Q_{{\bm{\theta}}_{2}}(s,a) which differ only in random initialization. Through interactions in the environment, the actor generates experience which is stored in a replay buffer B\mathcal{B}. This experience is sampled to train Qθ1Q_{{\bm{\theta}}_{1}} and Qθ2Q_{{\bm{\theta}}_{2}}. Simultaneously, the actor improves by maximizing Qθ1Q_{{\bm{\theta}}_{1}} via gradient ascent (Qθ2Q_{{\bm{\theta}}_{2}} is only used during critic training). Specifically, for an objective ff^{\prime} which is based on the critic and approximates ff, TD3 estimates a gradient f(ϕ){\bm{\nabla}}f^{\prime}({\bm{\phi}}) and passes it to an Adam optimizer. Notably, TD3 never updates network weights directly, instead accumulating weights into target networks πϕ\pi_{{\bm{\phi}}^{\prime}}, Qθ1Q_{{\bm{\theta}}^{\prime}_{1}}, Qθ2Q_{{\bm{\theta}}^{\prime}_{2}} via an exponentially weighted moving average with update rate τ\tau.

3.2 Quality Diversity Algorithms

3.2.1 MAP-Elites extensions for QD-RL

One of the simplest QD algorithms is MAP-Elites [40, 13]. MAP-Elites creates an archive A\mathcal{A} by tesselating the measure space X\mathcal{X} into a grid of evenly-sized cells. Then, it draws λ\lambda initial solutions from a multivariate Gaussian N(ϕ0,σI)\mathcal{N}(\mathbf{{\bm{\phi}}_{0}},\sigma{\bm{I}}) centered at some ϕ0{\bm{\phi}}_{0}. Next, for each sampled solution ϕ{\bm{\phi}}, MAP-Elites computes f(ϕ)f({\bm{\phi}}) and m(ϕ){\bm{m}}({\bm{\phi}}) and inserts ϕ{\bm{\phi}} into A\mathcal{A}. In subsequent iterations, MAP-Elites randomly selects λ\lambda solutions from A\mathcal{A} and adds Gaussian noise, i.e. solution ϕ{\bm{\phi}} becomes ϕ+N(0,σI){\bm{\phi}}+\mathcal{N}(\mathbf{0},\sigma{\bm{I}}). Solutions are placed into cells based on their measures; if a solution has higher ff than the solution currently in the cell, it replaces that solution. Once inserted into A\mathcal{A}, solutions are known as elites.

Due to the high dimensionality of neural network parameters, direct policy optimization with MAP-Elites has not proven effective in QD-RL [9], although indirect encodings have been shown to scale to large policy networks [50, 23]. For direct search, several extensions merge MAP-Elites with actor-critic methods and ES. For instance, Policy Gradient Assisted MAP-Elites (PGA-MAP-Elites) [42] combines MAP-Elites with TD3. Each iteration, PGA-MAP-Elites evaluates λ\lambda solutions for insertion into the archive. λ2\frac{\lambda}{2} of these are created by selecting random solutions from the archive and taking gradient ascent steps with a TD3 critic. The other λ2\frac{\lambda}{2} solutions are created with a directional variation operator [59] which selects two solutions ϕ1{\bm{\phi}}_{1} and ϕ2{\bm{\phi}}_{2} from the archive and creates a new one according to ϕ=ϕ1+σ1N(0,I)+σ2(ϕ2ϕ1)N(0,1){\bm{\phi}}^{\prime}={\bm{\phi}}_{1}+\sigma_{1}\mathcal{N}(\mathbf{0},{\bm{I}}% )+\sigma_{2}({\bm{\phi}}_{2}-{\bm{\phi}}_{1})\mathcal{N}(0,1). Finally, PGA-MAP-Elites maintains a “greedy actor” which provides actions when training the critics (identically to the actor in TD3). Every iteration, PGA-MAP-Elites inserts this greedy actor into the archive. PGA-MAP-Elites achieves state-of-the-art performance on locomotion tasks in the QDGym benchmark [43].

Another MAP-Elites extension is ME-ES [9], which combines MAP-Elites with an OpenAI-ES optimizer. In the “explore-exploit” variant, ME-ES alternates between two phases. In the “exploit” phase, ME-ES restarts OpenAI-ES at a mean ϕ{\bm{\phi}} and optimizes the objective for kk iterations, inserting the current ϕ{\bm{\phi}} into the archive in each iteration. In the “explore” phase, ME-ES repeats this process, but OpenAI-ES instead optimizes for novelty, where novelty is the distance in measure space from a new solution to previously encountered solutions. ME-ES also has an “exploit” variant and an “explore” variant, which each execute only one type of phase.

Our work is related to ME-ES in that we also adapt OpenAI-ES, but instead of alternating between following a novelty gradient and objective gradient, we compute all objective and measure gradients and allow a CMA-ES [28] instance to decide which gradients to follow by sampling gradient coefficients from a multivariate Gaussian updated over time (Sec. 3.2.2). We include MAP-Elites, PGA-MAP-Elites, and ME-ES as baselines in our experiments. Refer to Fig. 3 for a diagram which compares these algorithms to our approach.

3.2.2 Covariance Matrix Adaptation MAP-Elites via a Gradient Arborescence (CMA-MEGA)

We directly extend CMA-MEGA [18] to address QD-RL. CMA-MEGA is a DQD algorithm based on the QD algorithm CMA-ME [19]. The intuition behind CMA-MEGA is that if we knew which direction the current solution point ϕ{\bm{\phi}}^{*} should move in objective-measure space, then we could calculate that change in search space via a linear combination of objective and measure gradients. From CMA-ME, we know a good direction is one that results in the largest archive improvement.

Each iteration, CMA-MEGA first calculates objective and measure gradients for a solution point ϕ{\bm{\phi}}^{*}. Next, it generates λ\lambda new solutions by sampling gradient coefficients cN(μ,Σ){\bm{c}}\sim\mathcal{N}({\bm{\mu}},{\bm{\Sigma}}) and computing ϕϕ+c0f(ϕ)+j=1kcjmj(ϕ){\bm{\phi}}^{\prime}\leftarrow{\bm{\phi}}^{*}+c_{0}{\bm{\nabla}}f({\bm{\phi}}^% {*})+\sum_{j=1}^{k}c_{j}{\bm{\nabla}}m_{j}({\bm{\phi}}^{*}). CMA-MEGA inserts these solutions into the archive and computes their improvement, Δ\Delta. Δ\Delta is defined as f(ϕ)f({\bm{\phi}}^{\prime}) if ϕ{\bm{\phi}}^{\prime} populates a new cell, and f(ϕ)f(ϕE)f({\bm{\phi}}^{\prime})-f({\bm{\phi}}^{\prime}_{\mathcal{E}}) if ϕ{\bm{\phi}}^{\prime} improves an existing cell (replaces a previous solution ϕE{\bm{\phi}}^{\prime}_{\mathcal{E}}). After CMA-MEGA inserts the solutions, it ranks them by Δ\Delta. If a solution populates a new cell, its Δ\Delta always ranks higher than that of a solution which only improves an existing cell. CMA-MEGA then moves the solution point ϕ{\bm{\phi}}^{*} towards the largest archive improvement, but also adapts the distribution N(μ,Σ)\mathcal{N}({\bm{\mu}},{\bm{\Sigma}}) towards better gradient coefficients by the same ranking. By leveraging gradient information, CMA-MEGA solves QD benchmarks with orders of magnitude fewer solution evaluations than previous QD algorithms.

3.2.3 Beyond MAP-Elites

Several QD-RL algorithms have been developed outside the MAP-Elites family. NS-ES [11] builds on Novelty Search (NS) [35, 36], a family of QD algorithms which add solutions to an unstructured archive only if they are far away from existing archive solutions in measure space. Using OpenAI-ES, NS-ES concurrently optimizes several agents for novelty. Its variants NSR-ES and NSRA-ES optimize for a linear combination of novelty and objective. Meanwhile, the QD-RL algorithm [7] (distinct from the QD-RL problem we define) maintains an archive with all past solutions and optimizes agents along a Pareto front of the objective and novelty. Finally, Diversity via Determinants (DvD) [46] leverages a kernel method to maintain diversity in a population of solutions. As NS-ES, QD-RL, and DvD do not output a MAP-Elites grid archive, we leave their investigation for future work.

3.3 Diversity in Reinforcement Learning

Here we distinguish QD-RL from prior work which also applies diversity to RL. One area of work is in latent- and goal-conditioned policies. For latent-conditioned policy πϕ(as,z)\pi_{\bm{\phi}}(a|s,z) [16, 33, 37] or goal-conditioned policy πϕ(as,g)\pi_{\bm{\phi}}(a|s,g) [52, 3], varying the latent variable zz or goal gg results in different behaviors, e.g. different walking gaits or walking to a different location. While QD-RL also seeks a range of behaviors, the measures m(ϕ){\bm{m}}({\bm{\phi}}) are computed after evaluating ϕ{\bm{\phi}}, rather than before the evaluation. In general, QD-RL focuses on finding a variety of policies for a single task, rather than attempting to solve a variety of tasks with a single conditioned policy.

Another area of work combines evolutionary and actor-critic algorithms to solve single-objective hard-exploration problems [10, 31, 48, 56, 30]. In these methods, an evolutionary algorithm such as cross-entropy method [14] facilitates exploration by generating a diverse population of policies, while an actor-critic algorithm such as TD3 trains high-performing policies with this population’s environment experience. QD-RL differs from these methods in that it views diversity as a component of the output, while these methods view diversity as a means for environment exploration. Hence, QD-RL measures policy behavior via a measure function and collects diverse policies in an archive. In contrast, these RL exploration methods assume that trajectory diversity, rather than targeting specific behavioral diversity, is enough to drive exploration to discover a single optimal policy.

This diagram is a tree diagram with questions and answers that lead to each algorithm. At the top of the tree is the question "How are solutions generated?" On the left is the answer "Mutate solutions that are currently in the archive." In this case, the next question is "How are archive solutions modified?" If the answer is "Genetic algorithm operator," we arrive at MAP-Elites. If the answer is "Take multiple small gradient ascent steps with TD3," we arrive at PGA-MAP-Elites. Note that PGA-MAP-Elites also uses a genetic algorithm operator for some of its solutions. Going back to the original question ("How are solutions generated?"), the answer on the right says "Maintain an evolution strategy separate from the archive." In this case, the next question is "How are gradients combined when generating new solutions?" One answer is "Take an objective gradient or novelty gradient step with OpenAI-ES," in which case we arrive at the ME-ES algorithm. The other answer is "Maintain gradient coefficients with a CMA-ES instance," which leads to the question "How are gradients approximated?" Here, if we "Approximate objective gradient with OpenAI-ES" and "Approximate measure gradients with OpenAI-ES," we arrive at the CMA-MEGA (ES) algorithm. If we instead "Approximate objective gradient with TD3" and "Approximate measure gradients with OpenAI-ES," we arrive at the CMA-MEGA (TD3, ES) algorithm.
Figure 3: Diagram of MAP-Elites extensions for QD-RL, showing how our CMA-MEGA variants differ from other QD-RL algorithms.

4 Approximating Gradients for DQD

Since DQD algorithms require exact objective and measure gradients, we cannot directly apply CMA-MEGA to QD-RL. To address this limitation, we replace exact gradients with gradient approximations (Sec. 4.1) and develop two CMA-MEGA variants (Sec. 4.2).

4.1 Approximating Objective and Measure Gradients

We adapt gradient approximations from ES and actor-critic methods. Since the objective has an MDP structure, we estimate objective gradients f{\bm{\nabla}}f with ES and actor-critic methods. Since the measures are black boxes, we estimate measure gradients m{\bm{\nabla}}{\bm{m}} with ES.

4.1.1 Approximating objective gradients with ES and actor-critic methods

We estimate objective gradients with two methods. First, we treat the objective as a black box and estimate its gradient with a black box method, namely the OpenAI-ES gradient estimate in Eq. 3. Since OpenAI-ES performs well in RL domains [51, 45, 34], we believe this estimate is suitable for approximating gradients for CMA-MEGA in QD-RL settings. Importantly, this estimate requires environment interaction by evaluating λes\lambda_{es} solutions.

Since the objective has a well-defined structure, i.e. it is a sum of rewards from an MDP (Eq. 2), we also estimate its gradient with an actor-critic method, TD3. TD3 is well-suited for this purpose because it efficiently estimates objective gradients for the multiple policies that CMA-MEGA and other QD-RL algorithms generate. In particular, once the critic is trained, TD3 can provide a gradient estimate for any policy without additional environment interaction.

Among actor-critic methods, we select TD3 since it achieves high performance while optimizing primarily for the RL objective. Prior work [21] shows that TD3 outperforms on-policy actor-critic methods [53, 54]. While the off-policy Soft Actor-Critic [27] algorithm can outperform TD3, it optimizes a maximum-entropy objective designed to encourage exploration. In our work, we explore by finding policies with different measures. Thus, we leave for future work the problem of integrating QD-RL with the action diversity encouraged by entropy maximization.

4.1.2 Approximating measure gradients with ES

Since measures do not have special properties such as an MDP structure (Sec. 2.2), we only estimate their gradient with black box methods. Thus, similar to the objective, we approximate each measure’s gradient mi{\bm{\nabla}}{m_{i}} with the OpenAI-ES gradient estimate, replacing ff with mim_{i} in Eq. 3.

Since the OpenAI-ES gradient estimate requires additional environment interaction, all of our CMA-MEGA variants require environment interaction to estimate gradients. However, the environment interaction required to estimate measure gradients remains constant even as the number of measures increases, since we can reuse the same λes\lambda_{es} solutions to estimate each mi{\bm{\nabla}}{m_{i}}.

In problems where the measures have an MDP structure similar to the objective, it may be feasible to estimate each mi{\bm{\nabla}}{m_{i}} with its own TD3 instance. In the environments in our work (Sec. 5.1), each measure is non-Markovian since it calculates the proportion of time a walking agent’s foot spends on the ground. This calculation depends on the entire agent trajectory rather than on one state.

4.2 CMA-MEGA Variants

Algorithm 1

Our choice of gradient approximations leads to two CMA-MEGA variants. CMA-MEGA (ES) approximates objective and measure gradients with OpenAI-ES, while CMA-MEGA (TD3, ES) approximates the objective gradient with TD3 and measure gradients with OpenAI-ES. Fig. 1 shows an overview of both algorithms, and Algorithm 1 shows their pseudocode. As CMA-MEGA (TD3, ES) builds on CMA-MEGA (ES), we present only CMA-MEGA (TD3, ES) and highlight lines that CMA-MEGA (TD3, ES) additionally executes.

Identically to CMA-MEGA, the two variants maintain three primary components: a solution point ϕ{\bm{\phi}}^{*}, a multivariate Gaussian distribution N(μ,Σ)\mathcal{N}({\bm{\mu}},{\bm{\Sigma}}) for sampling gradient coefficients, and a MAP-Elites archive A\mathcal{A} for storing solutions. We initialize the archive and solution point on line 3, and we initialize the coefficient distribution as part of a CMA-ES instance on line 4.33 3 We set the CMA-ES batch size λ\lambda^{\prime} slightly lower than the total batch size λ\lambda (line 2). While CMA-MEGA (ES) and CMA-MEGA (TD3, ES) both evaluate λ\lambda solutions each iteration, one evaluation is reserved for ϕ{\bm{\phi}}^{*} (line 7). In CMA-MEGA (TD3, ES), one more evaluation is reserved for the greedy actor (line 26).

In the main loop (line 6), we follow the workflow shown in Fig. 1. First, after evaluating ϕ{\bm{\phi}}^{*} and inserting it into the archive (line 7-8), we approximate its gradients with either ES or TD3 (line 9-10). This gradient approximation forms the key difference between our variants and the original CMA-MEGA algorithm [18].

Next, we branch from ϕ{\bm{\phi}}^{*} to create solutions ϕi{\bm{\phi}}^{\prime}_{i} by sampling ci{\bm{c}}_{i} from the coefficient distribution and computing perturbations i{\bm{\nabla}}_{i} (line 13-15). We then evaluate each ϕi{\bm{\phi}}^{\prime}_{i} and insert it into the archive (line 16-17).

Finally, we update the solution point and the coefficient distribution’s CMA-ES instance by forming an improvement ranking based on the improvement Δi\Delta_{i} (Sec. 3.2.2; line 19-21). Importantly, since we rank based on improvement, this update enables the CMA-MEGA variants to maximize the QD objective (Eq. 1) [18].

Our CMA-MEGA variants have two additional components. First, we check if no solutions were inserted into the archive at the end of the iteration, which would indicate that we should reset the coefficient distribution and the solution point (line 22-24). Second, in the case of CMA-MEGA (TD3, ES), we manage a TD3 instance similar to how PGA-MAP-Elites does (Sec. 3.2.1). This TD3 instance consists of a replay buffer B\mathcal{B}, critic networks Qθ1Q_{{\bm{\theta}}_{1}} and Qθ2Q_{{\bm{\theta}}_{2}}, a greedy actor πϕq\pi_{{\bm{\phi}}_{q}}, and target networks Qθ1Q_{{\bm{\theta}}^{\prime}_{1}}, Qθ2Q_{{\bm{\theta}}^{\prime}_{2}}, πϕq\pi_{{\bm{\phi}}^{\prime}_{q}} (all initialized on line 5). At the end of each iteration, we use the greedy actor to train the critics, and we also insert it into the archive (line 26-29).

5 Experiments

We compare our two proposed CMA-MEGA variants (CMA-MEGA (ES), CMA-MEGA (TD3, ES)) with three baselines (PGA-MAP-Elites, ME-ES, MAP-Elites) in four locomotion tasks. We implement MAP-Elites as described in Sec. 3.2.1, and we select the explore-exploit variant for ME-ES since it has performed at least as well as both the explore variant and the exploit variant in several domains [9].

5.1 Evaluation Domains

5.1.1 QDGym

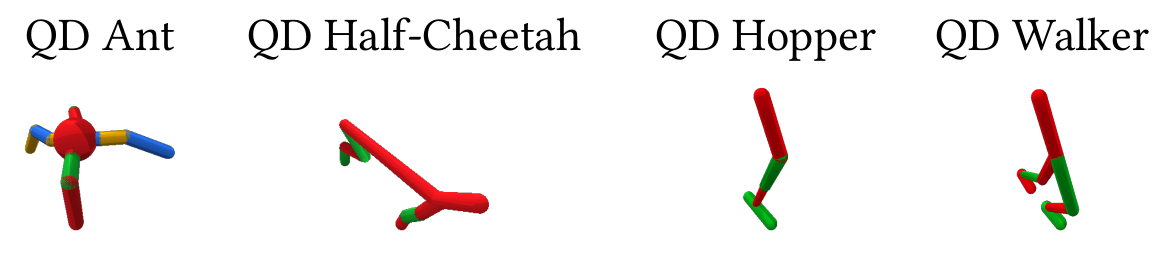
We evaluate our algorithms in four locomotion environments from QDGym [43], a library built on PyBullet Gym [12, 15] and OpenAI Gym [6]. Appendix C lists all environment details. In each environment, the QD algorithm outputs an archive of walking policies for a simulated agent. The agent is primarily rewarded for its forward speed. There are also reward shaping [41] signals, such as a punishment for applying higher joint torques, intended to guide policy optimization. The measures compute the proportion of time (number of timesteps divided by total timesteps in an episode) that each of the agent’s feet contacts the ground.

QDGym is challenging because the objective in each environment does not “align” with the measures, in that finding policies with different measures (i.e. exploring the archive) does not necessarily lead to optimization of the objective. While it may be trivial to fill the archive with low-performing policies which stand in place and lift the feet up and down to achieve different measures, the agents’ complexity (high degrees of freedom) makes it difficult to learn a high-performing policy for each value of the measures.

QDGym locomotion environments.

QD AntQD Half-CheetahQD HopperQD Walker

Figure 4: QDGym locomotion environments [43].

5.1.2 Hyperparameters

Each agent’s policy is a neural network which takes in states and outputs actions. There are two hidden layers of 128 nodes, and the hidden and output layers have tanh activation. We initialize weights with Xavier initialization [24].

For the archive, we tesselate each environment’s measure space into a grid of evenly-sized cells (see Table 6 for grid dimensions). Each measure is bound to the range [0,1][0,1], the min and max proportion of time that one foot can contact the ground.

Each algorithm evaluates 1 million solutions in the environment. Due to computational limits, we evaluate each solution once instead of averaging multiple episodes, so each algorithm runs 1 million episodes total. Refer to Appendix B for further hyperparameters.

5.1.3 Metrics

Our primary metric is QD score [49], which provides a holistic view of algorithm performance. QD score is the sum of the objective values of all elites in the archive, i.e. i=1M1ϕiexistsf(ϕi)\sum_{i=1}^{M}\bm{1}_{{\bm{\phi}}_{i}\mathrm{exists}}f({\bm{\phi}}_{i}), where MM is the number of archive cells. We note that the contribution of a cell to the QD score is 0 if the cell is unoccupied. We set the objective ff to be the expected undiscounted return, i.e. we set γ=1\gamma=1 in Eq. 2.

Since objectives may be negative, an algorithm’s QD score may be penalized when adding a new solution. To prevent this, we define a minimum objective in each environment by taking the lowest objective value that was inserted into the archive in any experiment in that environment. We subtract this minimum from every solution, such that every solution that was inserted into an archive has an objective value of at least 0. Thus, we use QD score defined as i=1M1ϕiexists(f(ϕi)min objective)\sum_{i=1}^{M}\bm{1}_{{\bm{\phi}}_{i}\mathrm{exists}}(f({\bm{\phi}}_{i})-% \mathrm{min\ objective}). We also define a maximum objective equivalent to each environment’s “reward threshold” in PyBullet Gym. This threshold is the objective value at which an agent is considered to have successfully learned to walk.

We report two metrics in addition to QD score. Archive coverage, the proportion of cells for which the algorithm found an elite, gauges how well the QD algorithm explores measure space, and best performance, the highest objective of any elite in the archive, gauges how well the QD algorithm exploits the objective.

5.2 Experimental Design

We follow a between-groups design, where the two independent variables are environment (QD Ant, QD Half-Cheetah, QD Hopper, QD Walker) and algorithm (CMA-MEGA (ES), CMA-MEGA (TD3, ES), PGA-MAP-Elites, ME-ES, MAP-Elites). The dependent variable is the QD score. In each environment, we run each algorithm for 5 trials with different random seeds and test three hypotheses:

H1: CMA-MEGA (ES) will outperform all baselines (PGA-MAP-Elites, ME-ES, MAP-Elites).

H2: CMA-MEGA (TD3, ES) will outperform all baselines.

H3: CMA-MEGA (TD3, ES) will outperform CMA-MEGA (ES).

H1 and H2 are based on prior work [18] which showed that in QD benchmark domains, CMA-MEGA outperforms algorithms that do not leverage both objective and measure gradients. H3 is based on results [45] which suggest that actor-critic methods outperform ES in PyBullet Gym. Thus, we expect the TD3 objective gradient to be more accurate than the ES objective gradient, leading to more efficient traversal of objective-measure space and higher QD score.

5.3 Implementation

We implement all QD algorithms with the pyribs library [57] except for ME-ES, which we adapt from the authors’ implementation. We run each experiment with 100 CPUs on a high-performance cluster. We allocate one NVIDIA Tesla P100 GPU to algorithms that train TD3 (CMA-MEGA (TD3, ES) and PGA-MAP-Elites). Depending on the algorithm and environment, each experiment lasts 4-20 hours; refer to Table 12, Appendix E for mean runtimes. We have released our source code at https://github.com/icaros-usc/dqd-rl

6 Results

Plots of metrics for all algorithms in all environments. Refer to caption.
Figure 5: Plots of QD score, archive coverage, and best performance for the 5 algorithms in our experiments in all 4 environments from QDGym. The x-axis in all plots is the number of solutions evaluated. Solid lines show the mean over 5 trials, and shaded regions show the standard error of the mean.

We ran 5 trials of each algorithm in each environment. In each trial, we allocated 1 million evaluations and recorded the QD score, archive coverage, and best performance. Fig. 5 plots these metrics, and Appendix E lists final values of all metrics. Appendix G shows example heatmaps and histograms of each archive, and the supplemental material contains videos of generated agents.

6.1 Analysis

To test our hypotheses, we conducted a two-way ANOVA which examined the effect of algorithm and environment on the QD score. We note that the ANOVA requires QD scores to have the same scale, but each environment’s QD score has a different scale by default. Thus, for this analysis, we normalized QD scores by dividing by each environment’s maximum QD score, defined as grid cells * (max objective - min objective) (see Appendix C for these quantities).

We found a statistically significant interaction between algorithm and environment on QD score, F(12,80)=16.82,p<0.001F(12,80)=16.82,p<0.001. Simple main effects analysis indicated that the algorithm had a significant effect on QD score in each environment, so we ran pairwise comparisons (two-sided t-tests) with Bonferroni corrections (Appendix F). Our results are as follows:

H1: There is no significant difference in QD score between CMA-MEGA (ES) and PGA-MAP-Elites in QD Ant and QD Half-Cheetah, but in QD Hopper and QD Walker, CMA-MEGA (ES) attains significantly lower QD score than PGA-MAP-Elites. CMA-MEGA (ES) achieves significantly higher QD score than ME-ES in all environments except QD Hopper, where there is no significant difference. There is no significant difference between CMA-MEGA (ES) and MAP-Elites in all domains except QD Hopper, where CMA-MEGA (ES) attains significantly lower QD score.

H2: In all environments, there is no significant difference in QD score between CMA-MEGA (TD3, ES) and PGA-MAP-Elites. CMA-MEGA (TD3, ES) achieves significantly higher QD score than ME-ES in all environments. CMA-MEGA (TD3, ES) achieves significantly higher QD score than MAP-Elites in QD Half-Cheetah and Walker, with no significant difference in QD Ant and QD Hopper.

H3: CMA-MEGA (TD3, ES) achieves significantly higher QD score than CMA-MEGA (ES) in QD Hopper and QD Walker, but there is no significant difference in QD Ant and QD Half-Cheetah.

6.2 Discussion

We discuss how the CMA-MEGA variants differ from the baselines (Sec. 6.2.1-6.2.4) and how they differ from each other (Sec. 6.2.5).

6.2.1 PGA-MAP-Elites and objective-measure space exploration

Of the CMA-MEGA variants, CMA-MEGA (TD3, ES) performed the closest to PGA-MAP-Elites, with no significant QD score difference in any environment. This result differs from prior work [18] in QD benchmark domains, where CMA-MEGA outperformed OG-MAP-Elites, a baseline DQD algorithm inspired by PGA-MAP-Elites.

We attribute this difference to the difficulty of exploring objective-measure space in the benchmark domains. For example, the linear projection benchmark domain is designed to be “distorted” [19]. Values in the center of its measure space are easy to obtain with random sampling, while values at the edges are unlikely to be sampled. Hence, high QD score arises from exploring measure space and filling the archive. Since CMA-MEGA adapts its sampling distribution, it is able to perform this exploration, while OG-MAP-Elites remains “stuck” in the center of the measure space.

In contrast, as discussed in Sec. 5.1.1, it is relatively easy to fill the archive in QDGym. We see this empirically: in all environments, all algorithms achieve nearly 100% archive coverage, usually within the first 250k evaluations (Fig. 5). Hence, the best QD score is achieved by increasing the objective value of solutions after filling the archive. PGA-MAP-Elites achieves this by optimizing half of its generated solutions with respect to its TD3 critic. The genetic operator likely further enhances the efficacy of this optimization, by taking previously-optimized solutions and combining them to obtain high-performing solutions in other parts of the archive.

On the other hand, the CMA-MEGA variants place less emphasis on maximizing the performance of each solution, compared to PGA-MAP-Elites: in each trial, PGA-MAP-Elites takes 5 million objective gradient steps with respect to its TD3 critic, while the CMA-MEGA variants only compute 5k objective gradients, because they dedicate a large part of the evaluation to estimating the measure gradients. This difference suggests a possible extension to CMA-MEGA (TD3, ES) in which solutions are optimized with respect to the TD3 critic before being evaluated in the environment.

6.2.2 PGA-MAP-Elites and optimization efficiency

While there was no significant difference in the final QD scores of CMA-MEGA (TD3, ES) and PGA-MAP-Elites, CMA-MEGA (TD3, ES) was less efficient than PGA-MAP-Elites in some environments. For instance, in QD Hopper, PGA-MAP-Elites reached 1.5M QD score after 100k evaluations, but CMA-MEGA (TD3, ES) required 400k evaluations.

We can quantify optimization efficiency with QD score AUC, the area under the curve (AUC) of the QD score plot. For a QD algorithm which executes NN iterations and evaluates λ\lambda solutions per iteration, we define QD score AUC as a Riemann sum: QD score AUC =i=1N(λ=\sum_{i=1}^{N}(\lambda* QD score at iteration i)i) After computing QD score AUC, we ran statistical analysis similar to Sec. 6.1 and found CMA-MEGA (TD3, ES) had significantly lower QD score AUC than PGA-MAP-Elites in QD Ant and QD Hopper. There was no significant difference in QD Half-Cheetah and QD Walker. As such, while CMA-MEGA (TD3, ES) obtained comparable final QD scores to PGA-MAP-Elites in all tasks, it was less efficient at achieving those scores in QD Ant and QD Hopper.

6.2.3 ME-ES and archive insertions

With one exception (CMA-MEGA (ES) in QD Hopper), both CMA-MEGA variants achieved significantly higher QD score than ME-ES in all environments. We attribute this result to the number of solutions each algorithm inserts into the archive. Each iteration, ME-ES evaluates 200 solutions (Appendix B) but only inserts one into the archive, for a total of 5000 solutions inserted during each run. Given that each archive has at least 1000 cells, ME-ES has, on average, 5 opportunities to insert a solution that improves each cell. In contrast, the CMA-MEGA variants have 100 times more insertions. Though the CMA-MEGA variants evaluate 200 solutions per iteration, they insert 100 of these into the archive. This totals to 500k insertions per run, allowing the CMA-MEGA variants to gradually improve archive cells.

6.2.4 MAP-Elites and robustness

In most cases, both CMA-MEGA variants had significantly higher QD score than MAP-Elites or no significant difference, but in QD Hopper, MAP-Elites achieved significantly higher QD score than CMA-MEGA (ES). However, we found that MAP-Elites solutions were less robust (see Appendix D).

6.2.5 CMA-MEGA variants and gradient estimates

In QD Hopper and QD Walker, CMA-MEGA (TD3, ES) had significantly higher QD score than CMA-MEGA (ES). One potential explanation is that PyBullet Gym (and hence QDGym) augments rewards with reward shaping signals intended to promote optimal solutions for deep RL algorithms. In prior work [45], these signals led PPO [54] to train successful walking agents, while they led OpenAI-ES into local optima. For instance, OpenAI-ES trained agents which stood still so as to maximize only the reward signal for staying upright.

Due to these signals, TD3’s objective gradient seems more useful than that of OpenAI-ES in QD Hopper and QD Walker. In fact, the algorithms which performed best in QD Hopper and QD Walker were ones that calculated objective gradients with TD3, i.e. PGA-MAP-Elites and CMA-MEGA (TD3, ES).

Prior work [45] found that rewards could be tailored for ES, such that OpenAI-ES outperformed PPO. Extensions of our work could investigate whether there is a similar effect for QD algorithms, where tailoring the reward leads CMA-MEGA (ES) to outperform PGA-MAP-Elites and CMA-MEGA (TD3, ES).

7 Conclusion

To extend DQD to RL settings, we adapted gradient approximations from actor-critic methods and ES. By integrating these approximations with CMA-MEGA, we proposed two novel variants that we evaluated on four locomotion tasks from QDGym. CMA-MEGA (TD3, ES) performed comparably to the state-of-the-art PGA-MAP-Elites in all tasks but was less efficient in two of the tasks. CMA-MEGA (ES) performed comparably in two tasks.

Our results contrast prior work [18] where CMA-MEGA outperformed a baseline algorithm inspired by PGA-MAP-Elites in QD benchmark domains. The difference seems to be that difficulty in the benchmarks arises from a hard-to-explore measure space, whereas difficulty in QDGym arises from an objective which requires rigorous optimization. As such, future work could formalize the notions of “exploration difficulty” of a measure space and “optimization difficulty” of an objective and evaluate algorithms in benchmarks that cover a spectrum of these metrics.

For practitioners looking to apply DQD in RL settings, we recommend estimating objective gradients with an off-policy actor-critic method such as TD3 instead of with an ES. Due to the difficulty of modern control benchmarks, it is important to efficiently optimize the objective — TD3 benefits over ES since it can compute the objective gradient without further environment interaction. Furthermore, reward signals in these benchmarks are designed for deep RL methods, making TD3 gradients more useful than ES gradients.

By reducing QD-RL to DQD, we have decoupled QD-RL into DQD optimization and RL gradient approximations. In the future, we envision algorithms which benefit from advances in either more efficient DQD or more accurate RL gradient approximations.

If you have any questions or comments, please visit the GitHub discussions for this page.

Acknowledgments

The authors thank the anonymous reviewers, Ya-Chuan Hsu, Heramb Nemlekar, and Gautam Salhotra for their invaluable feedback. This work was partially supported by the NSF NRI (#1053128) and NSF GRFP (#DGE-1842487).

This website was built with 11ty, cheerio, KaTeX, LaTeXML, Preact, and tailwindcss.

Citation

This work is currently a preprint on arXiv. It will appear in GECCO 2022.

@inproceedings{10.1145/3512290.3528705,
  author = {Tjanaka, Bryon and Fontaine, Matthew C. and Togelius, Julian and Nikolaidis, Stefanos},
  title = {Approximating Gradients for Differentiable Quality Diversity in Reinforcement Learning},
  year = {2022},
  isbn = {9781450392372},
  publisher = {Association for Computing Machinery},
  address = {New York, NY, USA},
  url = {https://doi.org/10.1145/3512290.3528705},
  doi = {10.1145/3512290.3528705},
  abstract = {Consider the problem of training robustly capable agents. One approach is to generate a diverse collection of agent polices. Training can then be viewed as a quality diversity (QD) optimization problem, where we search for a collection of performant policies that are diverse with respect to quantified behavior. Recent work shows that differentiable quality diversity (DQD) algorithms greatly accelerate QD optimization when exact gradients are available. However, agent policies typically assume that the environment is not differentiable. To apply DQD algorithms to training agent policies, we must approximate gradients for performance and behavior. We propose two variants of the current state-of-the-art DQD algorithm that compute gradients via approximation methods common in reinforcement learning (RL). We evaluate our approach on four simulated locomotion tasks. One variant achieves results comparable to the current state-of-the-art in combining QD and RL, while the other performs comparably in two locomotion tasks. These results provide insight into the limitations of current DQD algorithms in domains where gradients must be approximated. Source code is available at https://github.com/icaros-usc/dqd-rl},
  booktitle = {Proceedings of the Genetic and Evolutionary Computation Conference},
  pages = {1102–1111},
  numpages = {10},
  keywords = {neuroevolution, reinforcement learning, quality diversity},
  location = {Boston, Massachusetts},
  series = {GECCO '22}
}

Open Source Code

The code for our experiments is available at https://github.com/icaros-usc/dqd-rl

License

The text and figures of this work are licensed under the Creative Commons Attribution CC-BY 4.0 unless otherwise noted.

Appendix A Helper Functions for CMA-MEGA Variants

Algorithm 2
Algorithm 3
Algorithm 4

Appendix B Algorithm Hyperparameters

Here we list parameters for each algorithm in our experiments. Refer to Sec. 5.1.2 for parameters of the neural network policy and the archive. All algorithms are allocated 1,000,000 evaluations total.

Table 1: CMA-MEGA (ES) and CMA-MEGA (TD3, ES) hyperparameters. npgn_{pg} and ncritn_{crit} are only applicable in CMA-MEGA (TD3, ES). npgn_{pg} here is analogous to npgn_{pg} in PGA-MAP-Elites, but we make it much larger here (65,536 vs. 256) to improve the accuracy of the gradient estimate. It is important to obtain a more accurate gradient estimate since we only compute one gradient per iteration instead of taking gradient steps on multiple solutions.
ParameterDescriptionValue
NNIterations = 1,000,000 / (λ+λes\lambda+\lambda_{es})5,000
λ\lambdaBatch size100
σg\sigma_{g}Initial CMA-ES step size1.0
η\etaGradient ascent learning rate1.0
λes\lambda_{es}ES batch size100
σe\sigma_{e}ES noise standard deviation0.02
npgn_{pg}TD3 gradient estimate batch size65,536
ncritn_{crit}TD3 critic training steps600
Table 2: PGA-MAP-Elites hyperparameters.
ParameterDescriptionValue
NNIterations = 1,000,000 / λ\lambda10,000
λ\lambdaBatch size100
nevon_{evo}Variation operators split0.5λ=500.5\lambda=50
ngradn_{grad}PG variation steps10
αgrad\alpha_{grad}PG variation learning rate (for Adam)0.001
npgn_{pg}PG variation batch size256
ncritn_{crit}TD3 critic training steps300
σ1\sigma_{1}GA variation 10.005
σ2\sigma_{2}GA variation 20.05
GGRandom initial solutions100
Table 3: ME-ES hyperparameters. We adopt the explore-exploit variant.
ParameterDescriptionValue
NNIterations = 1,000,000 / λ\lambda5,000
λ\lambdaBatch size200
σ\sigmaES noise standard deviation0.02
noptim_gensn_{optim\_gens}Consecutive generations to optimize a solution10
α\alphaLearning rate for Adam0.01
α2\alpha_{2}L2 coefficient for Adam0.005
kkNearest neighbors for novelty calculation10
Table 4: MAP-Elites hyperparameters. We describe MAP-Elites in Sec. 3.2.1.
ParameterDescriptionValue
NNIterations = 1,000,000 / λ\lambda10,000
λ\lambdaBatch size100
σ\sigmaGaussian noise standard deviation0.02
Table 5: TD3 hyperparameters common to CMA-MEGA (TD3, ES) and PGA-MAP-Elites, which both train a TD3 instance. Furthermore, though we record the objective with γ=1\gamma=1 (Sec. 5.1.3), TD3 still executes with γ<1\gamma<1.
ParameterDescriptionValue
Critic layer sizes[256,256,1][256,256,1]
αcrit\alpha_{crit}Critic learning rate (for Adam)3e-4
nqn_{q}Critic training batch size256
B|\mathcal{B}|Max replay buffer size1,000,000
γ\gammaDiscount factor0.99
τ\tauTarget network update rate0.005
ddTarget network update frequency2
σp\sigma_{p}Smoothing noise standard deviation0.2
cclipc_{clip}Smoothing noise clip0.5

Appendix C Environment Details

Table 6: QDGym environments details. We list the dimensions of the state space (S|\mathcal{S}|) and action space (U|\mathcal{U}|), number of neural network parameters, number of measures X|\mathcal{X}|, archive grid dimensions (number of cells along each dimension), total archive grid cells, and min and max objectives (Sec. 5.1.3).

QD AntQD Half-CheetahQD HopperQD Walker

QD AntQD Half-CheetahQD HopperQD Walker

S|\mathcal{S}|
28261522
U|\mathcal{U}|8636
Parameters21,25620,74218,94720,230
X|\mathcal{X}|4212
Archive dim[6,6,6,6][32,32][1024][32,32]
Grid cells1,2961,0241,0241,024
Min objective-374.70-2,797.52-362.09-67.17
Max objective2,500.003,000.002,500.002,500.00

Table 6 lists all environment details. The measures in QDGym are the proportions of time that each foot contacts the ground. In each environment, the feet are ordered as follows:

  • QD Ant: front left foot, front right foot, back left foot, back right foot

  • QD Half-Cheetah: front foot, back foot

  • QD Hopper: single foot

  • QD Walker: right foot, left foot

Appendix D MAP-Elites and robustness

In most cases, both CMA-MEGA variants had significantly higher QD score than MAP-Elites or no significant difference, but in QD Hopper, MAP-Elites achieved significantly higher QD score than CMA-MEGA (ES). However, when we visualized solutions found by MAP-Elites, their performance was lower than the performance recorded in the archive. The best MAP-Elites solution in QD Hopper hopped forward a few steps and fell down, despite recording an excellent performance of 2,648.31.

One explanation for this behavior is that since we only evaluate solutions for one episode before inserting into the archive, a solution with noisy performance may be inserted because of a single high-performing episode, even if it performs poorly on average. Prior work [42] has also encountered this issue when running MAP-Elites with a directional variation operator [59] in QDGym, and has suggested measuring robustness as a proxy for how much noise is present in an archive’s solutions. Robustness is defined as the difference between the mean performance of the solution over nn episodes (we use n=10n=10) and the performance recorded in the archive. The larger (more negative) this difference, the more noisy and less robust the solution.

To compare the robustness of the solutions output by the CMA-MEGA variants and MAP-Elites, we computed mean elite robustness, the average robustness of all elites in each experiment’s final archive. We then ran statistical analysis similar to Sec. 6.1. In all environments, both CMA-MEGA (ES) and CMA-MEGA (TD3, ES) had significantly higher mean elite robustness than MAP-Elites (Appendix E & F). Overall, though MAP-Elites achieves high QD score, its solutions are less robust.

Appendix E Final Metrics

Tables 7-12 show the QD score (Sec. 5.1.3), QD score AUC (Sec. 6.2.1), archive coverage (Sec. 5.1.3), best performance (Sec. 5.1.3), mean elite robustness (Sec. 6.2.4), and runtime in hours for all algorithms in all environments. The tables show the value of each metric after 1 million evaluations, averaged over 5 trials. Due to its magnitude, QD score AUC is expressed as a multiple of 101210^{12}.

Though CMA-MEGA (TD3, ES) and PGA-MAP-Elites perform best overall, they rely on specialized hardware (a GPU) and require the most computation. As shown in Table 12, the TD3 training in these algorithms leads to long runtimes. When runtime is dominated by the algorithm itself (as opposed to solution evaluations), CMA-MEGA (ES) offers a viable alternative that may achieve reasonable performance.

Table 7: QD Score
QD AntQD Half-CheetahQD HopperQD Walker
CMA-MEGA (ES)1,649,846.694,489,327.041,016,897.48371,804.19
CMA-MEGA (TD3, ES)1,479,725.624,612,926.991,857,671.121,437,319.62
PGA-MAP-Elites1,674,374.814,758,921.892,068,953.541,480,443.84
ME-ES539,742.082,296,974.58791,954.55105,320.97
MAP-Elites1,418,306.564,175,704.191,835,703.73447,737.90
Table 8: QD Score AUC (multiple of 101210^{12})
QD AntQD Half-CheetahQD HopperQD Walker
CMA-MEGA (ES)1.313.960.740.28
CMA-MEGA (TD3, ES)1.143.971.391.01
PGA-MAP-Elites1.394.391.811.04
ME-ES0.351.570.490.07
MAP-Elites1.183.781.340.35
Table 9: Archive Coverage
QD AntQD Half-CheetahQD HopperQD Walker
CMA-MEGA (ES)0.961.000.971.00
CMA-MEGA (TD3, ES)0.971.000.981.00
PGA-MAP-Elites0.961.000.970.99
ME-ES0.630.950.740.86
MAP-Elites0.981.000.981.00
Table 10: Best Performance
QD AntQD Half-CheetahQD HopperQD Walker
CMA-MEGA (ES)2,213.062,265.731,441.00940.50
CMA-MEGA (TD3, ES)2,482.832,486.102,597.872,302.31
PGA-MAP-Elites2,843.862,746.982,884.082,619.17
ME-ES2,515.201,911.332,642.301,025.74
MAP-Elites1,506.971,822.882,602.94989.31
Table 11: Mean Elite Robustness
QD AntQD Half-CheetahQD HopperQD Walker
CMA-MEGA (ES)-51.62-105.81-187.44-86.45
CMA-MEGA (TD3, ES)-48.91-80.78-273.68-97.40
PGA-MAP-Elites-4.16-92.38-435.45-74.26
ME-ES77.76-645.40-631.322.05
MAP-Elites-109.42-338.78-509.21-186.14
Table 12: Runtime (Hours)
QD AntQD Half-CheetahQD HopperQD Walker
CMA-MEGA (ES)7.407.243.843.52
CMA-MEGA (TD3, ES)16.2622.7913.4313.01
PGA-MAP-Elites19.9919.7512.6512.86
ME-ES8.9210.254.044.12
MAP-Elites7.437.374.595.72

Appendix F Full Statistical Analysis

To compare a metric such as QD score between two or more algorithms across all four QDGym environments, we performed a two-way ANOVA where environment and algorithm were the independent variables and the metric was the dependent variable. When there was a significant interaction effect (note that all of our analyses found significant interaction effects), we followed up this ANOVA with a simple main effects analysis in each environment. Finally, we ran pairwise comparisons (two-sided t-tests) to determine which algorithms had a significant difference on the metric. We applied Bonferroni corrections within each environment / simple main effect. For example, in Table 13 we compared CMA-MEGA (ES) with three algorithms in each environment, so we applied a Bonferroni correction with n=3n=3.

This section lists the ANOVA and pairwise comparison results for each of our analyses. We have bolded all significant pp-values, where significance is determined at the α=0.05\alpha=0.05 threshold. For pairwise comparisons, some pp-values are marked as “1” because the Bonferroni correction caused the pp-value to exceed 1. pp-values less than 0.001 have been marked as “< 0.001”.

F.1 QD Score Analysis (Sec. 6.1)

To test the hypotheses we defined in Sec. 5.2, we performed a two-way ANOVA for QD scores. Since the ANOVA requires scores in all environments to have the same scale, we normalized the QD score in all environments by dividing by the maximum QD score, defined in Sec. 6.1 as grid cells * (max objective - min objective). The results of the ANOVA were as follows:

  • Interaction effect: F(12,80)=16.82,p<0.001F(12,80)=16.82,\mathbf{p<0.001}

  • Simple main effects:

    • QD Ant: F(4,80)=23.87,p<0.001F(4,80)=23.87,\mathbf{p<0.001}

    • QD Half-Cheetah: F(4,80)=44.15,p<0.001F(4,80)=44.15,\mathbf{p<0.001}

    • QD Hopper: F(4,80)=57.35,p<0.001F(4,80)=57.35,\mathbf{p<0.001}

    • QD Walker: F(4,80)=90.84,p<0.001F(4,80)=90.84,\mathbf{p<0.001}

Since the ANOVA showed a significant interaction effect and significant simple main effects, we performed pairwise comparisons for each hypothesis (Tables 13-15).

F.2 QD Score AUC Analysis (Sec. 6.2.1)

In this followup analysis, we hypothesized that PGA-MAP-Elites would have greater QD score AUC than CMA-MEGA (ES) and CMA-MEGA (TD3, ES). Thus, we performed a two-way ANOVA which compared QD score AUC for PGA-MAP-Elites, CMA-MEGA (ES), and CMA-MEGA (TD3, ES). As we did for QD score, we normalized QD score AUC by the maximum QD score. The ANOVA results were as follows:

  • Interaction effect: F(12,80)=17.55,p<0.001F(12,80)=17.55,\mathbf{p<0.001}

  • Simple main effects:

    • QD Ant: F(4,80)=31.77,p<0.001F(4,80)=31.77,\mathbf{p<0.001}

    • QD Half-Cheetah: F(4,80)=89.38,p<0.001F(4,80)=89.38,\mathbf{p<0.001}

    • QD Hopper: F(4,80)=82.34,p<0.001F(4,80)=82.34,\mathbf{p<0.001}

    • QD Walker: F(4,80)=71.64,p<0.001F(4,80)=71.64,\mathbf{p<0.001}

As the interaction and simple main effects were significant, we performed pairwise comparisons (Table 16).

F.3 Mean Elite Robustness Analysis (Sec. 6.2.4)

In this followup analysis, we hypothesized that MAP-Elites would have lower mean elite robustness than CMA-MEGA (ES) and CMA-MEGA (TD3, ES). Thus, we performed a two-way ANOVA which compared mean elite robustness for MAP-Elites, CMA-MEGA (ES), and CMA-MEGA (TD3, ES). We normalized by the score range, i.e. max objective - min objective. The ANOVA results were as follows:

  • Interaction effect: F(12,80)=8.75,p<0.001F(12,80)=8.75,\mathbf{p<0.001}

  • Simple main effects:

    • QD Ant: F(4,80)=3.17,p=0.018F(4,80)=3.17,\mathbf{p=0.018}

    • QD Half-Cheetah: F(4,80)=9.60,p<0.001F(4,80)=9.60,\mathbf{p<0.001}

    • QD Hopper: F(4,80)=21.07,p<0.001F(4,80)=21.07,\mathbf{p<0.001}

    • QD Walker: F(4,80)=3.70,p=0.008F(4,80)=3.70,\mathbf{p=0.008}

As the interaction and simple main effects were significant, we performed pairwise comparisons (Table 17).

Table 13: H1 - Comparing QD score between CMA-MEGA (ES) and baselines
QD AntQD Half-CheetahQD HopperQD Walker
Algorithm 1Algorithm 2
CMA-MEGA (ES)PGA-MAP-Elites10.7330.003< 0.001
ME-ES< 0.001< 0.0010.841< 0.001
MAP-Elites0.2540.2150.0070.108
Table 14: H2 - Comparing QD score between CMA-MEGA (TD3, ES) and baselines
QD AntQD Half-CheetahQD HopperQD Walker
Algorithm 1Algorithm 2
CMA-MEGA (TD3, ES)PGA-MAP-Elites0.09310.7261
ME-ES< 0.001< 0.001< 0.001< 0.001
MAP-Elites10.0101< 0.001
Table 15: H3 - Comparing QD score between CMA-MEGA (ES) and CMA-MEGA (TD3, ES)
QD AntQD Half-CheetahQD HopperQD Walker
Algorithm 1Algorithm 2
CMA-MEGA (ES)CMA-MEGA (TD3, ES)0.2500.5110.006< 0.001
Table 16: Comparing QD score AUC between PGA-ME and CMA-MEGA variants
QD AntQD Half-CheetahQD HopperQD Walker
Algorithm 1Algorithm 2
PGA-MAP-ElitesCMA-MEGA (ES)0.7340.255< 0.001< 0.001
CMA-MEGA (TD3, ES)0.0200.1110.0031
Table 17: Comparing mean elite robustness between MAP-Elites and CMA-MEGA variants
QD AntQD Half-CheetahQD HopperQD Walker
Algorithm 1Algorithm 2
MAP-ElitesCMA-MEGA (ES)< 0.001< 0.0010.0300.003
CMA-MEGA (TD3, ES)< 0.001< 0.0010.013< 0.001

Appendix G Archive Visualizations

We visualize “median” archives in Fig. 6 and Fig. 7. To determine these median archives, we selected the trial which achieved the median QD score out of the 5 trials of each algorithm in each environment. Fig. 6 visualizes heatmaps of median archives in QD Half-Cheetah and QD Walker, while Fig. 7 shows the distribution (histogram) of objective values for median archives in all environments.

Figure 6: Archive heatmaps from the median trial (in terms of QD score) of each algorithm in QD Half-Cheetah and QD Walker. The colorbar for each environment ranges from the minimum to maximum objective stated in Table 6. The archive in both environments is a 32×3232\times 32 grid. Currently, we are unable to plot heatmaps for QD Ant and QD Hopper because their archives are not 2D.

These heatmaps have several notable features. First, we can see that MAP-Elites primarily discovers low-performing solutions. Second, from looking at the heatmap videos, we can see that PGA-MAP-Elites gradually improves the entire archive “all at once” — this happens because PGA-MAP-Elites samples solutions uniformly from the archive and applies variations to them, so the entire archive appears to improve simultaneously. Finally, again based on the heatmap videos, we see that the CMA-MEGA variants improve the archive with “paintbrush strokes.” This happens because the CMA-MEGA variants gradually move the solution point ϕ{\bm{\phi}}^{*} around the archive while generating solutions around it.
Figure 7: Distribution (histogram) of objective values in archives from the median trial (in terms of QD score) of each algorithm in each environment. In each plot, the x-axis is bounded on the left by the minimum objective and on the right by the maximum objective plus 400, as some solutions exceed the maximum objective in Table 6. Note that in some plots, the number of items overflows the y-axis bounds (e.g. ME-ES in QD Walker).

References

  • [1] Y. Akimoto, Y. Nagata, I. Ono, and S. Kobayashi (2010) Bidirectional relation between cma evolution strategies and natural evolution strategies. In Parallel Problem Solving from Nature, PPSN XI, R. Schaefer, C. Cotta, J. Kołodziej, and G. Rudolph (Eds.), Berlin, Heidelberg, pp. 154–163. External Links: ISBN 978-3-642-15844-5 Cited by: §1.
  • [2] S. Amari (1998-02) Natural Gradient Works Efficiently in Learning. Neural Computation 10 (2), pp. 251–276. External Links: ISSN 0899-7667, Document, Link, https://direct.mit.edu/neco/article-pdf/10/2/251/813415/089976698300017746.pdf Cited by: §3.1.1.
  • [3] M. Andrychowicz, F. Wolski, A. Ray, J. Schneider, R. Fong, P. Welinder, B. McGrew, J. Tobin, O. Pieter Abbeel, and W. Zaremba (2017) Hindsight experience replay. In Advances in Neural Information Processing Systems, I. Guyon, U. V. Luxburg, S. Bengio, H. Wallach, R. Fergus, S. Vishwanathan, and R. Garnett (Eds.), Vol. 30, pp. . External Links: Link Cited by: §3.3.
  • [4] H. Beyer and H. Schwefel (2002-03-01) Evolution strategies – a comprehensive introduction. Natural Computing 1 (1), pp. 3–52. External Links: ISSN 1572-9796, Document, Link Cited by: §3.1.1.
  • [5] D. Brockhoff, A. Auger, N. Hansen, D. V. Arnold, and T. Hohm (2010) Mirrored sampling and sequential selection for evolution strategies. In Parallel Problem Solving from Nature, PPSN XI, R. Schaefer, C. Cotta, J. Kołodziej, and G. Rudolph (Eds.), Berlin, Heidelberg, pp. 11–21. External Links: ISBN 978-3-642-15844-5 Cited by: §3.1.1.
  • [6] G. Brockman, V. Cheung, L. Pettersson, J. Schneider, J. Schulman, J. Tang, and W. Zaremba (2016) OpenAI gym. CoRR abs/1606.01540. External Links: Link, 1606.01540 Cited by: §5.1.1.
  • [7] G. Cideron, T. Pierrot, N. Perrin, K. Beguir, and O. Sigaud (2020) QD-RL: efficient mixing of quality and diversity in reinforcement learning. CoRR abs/2006.08505. External Links: Link, 2006.08505 Cited by: §3.2.3.
  • [8] J. Clark and D. Amodei (2016) Faulty reward functions in the wild. Note: https://openai.com/blog/faulty-reward-functions/ Cited by: §1.
  • [9] C. Colas, V. Madhavan, J. Huizinga, and J. Clune (2020) Scaling map-elites to deep neuroevolution. In Proceedings of the 2020 Genetic and Evolutionary Computation Conference, GECCO ’20, New York, NY, USA, pp. 67–75. External Links: ISBN 9781450371285, Link, Document Cited by: §1, §1, §3.2.1, §3.2.1, §5.
  • [10] C. Colas, O. Sigaud, and P. Oudeyer (2018-10–15 Jul) GEP-PG: decoupling exploration and exploitation in deep reinforcement learning algorithms. In Proceedings of the 35th International Conference on Machine Learning, J. Dy and A. Krause (Eds.), Proceedings of Machine Learning Research, Vol. 80, pp. 1039–1048. External Links: Link Cited by: §3.3.
  • [11] E. Conti, V. Madhavan, F. Petroski Such, J. Lehman, K. Stanley, and J. Clune (2018) Improving exploration in evolution strategies for deep reinforcement learning via a population of novelty-seeking agents. In Advances in Neural Information Processing Systems 31, S. Bengio, H. Wallach, H. Larochelle, K. Grauman, N. Cesa-Bianchi, and R. Garnett (Eds.), pp. 5027–5038. External Links: Link Cited by: §3.2.3.
  • [12] E. Coumans and Y. Bai (2016–2020) PyBullet, a python module for physics simulation for games, robotics and machine learning. Note: http://pybullet.org Cited by: §5.1.1.
  • [13] A. Cully, J. Clune, D. Tarapore, and J. Mouret (2015-05) Robots that can adapt like animals. Nature 521, pp. 503–507. External Links: Document Cited by: §1, §1, §2.1, §3.2.1.
  • [14] P. de Boer, D. P. Kroese, S. Mannor, and R. Y. Rubinstein (2005-02-01) A tutorial on the cross-entropy method. Annals of Operations Research 134 (1), pp. 19–67. External Links: ISSN 1572-9338, Document, Link Cited by: §3.3.
  • [15] B. Ellenberger (2018–2019) PyBullet gymperium. Note: https://github.com/benelot/pybullet-gym Cited by: §1, §5.1.1.
  • [16] B. Eysenbach, A. Gupta, J. Ibarz, and S. Levine (2019) Diversity is all you need: learning skills without a reward function. In International Conference on Learning Representations, External Links: Link Cited by: §3.3.
  • [17] M. C. Fontaine, Y. Hsu, Y. Zhang, B. Tjanaka, and S. Nikolaidis (2021) On the importance of environments in human-robot coordination. Robotics: Science and Systems. Cited by: §1.
  • [18] M. C. Fontaine and S. Nikolaidis (2021) Differentiable quality diversity. Advances in Neural Information Processing Systems 34. External Links: Link Cited by: §1, §1, §1, §1, §2.1, §3.2.2, §4.2, §4.2, §5.2, §6.2.1, §7.
  • [19] M. C. Fontaine, J. Togelius, S. Nikolaidis, and A. K. Hoover (2020) Covariance matrix adaptation for the rapid illumination of behavior space. In Proceedings of the 2020 Genetic and Evolutionary Computation Conference, GECCO ’20, New York, NY, USA, pp. 94–102. External Links: ISBN 9781450371285, Link, Document Cited by: §3.2.2, §6.2.1.
  • [20] M. Fontaine and S. Nikolaidis (2021) A quality diversity approach to automatically generating human-robot interaction scenarios in shared autonomy. Robotics: Science and Systems. Cited by: §1.
  • [21] S. Fujimoto, H. van Hoof, and D. Meger (2018-10–15 Jul) Addressing function approximation error in actor-critic methods. In Proceedings of the 35th International Conference on Machine Learning, J. Dy and A. Krause (Eds.), Proceedings of Machine Learning Research, Vol. 80, pp. 1587–1596. External Links: Link Cited by: §1, §3.1.2, §4.1.1, 3.
  • [22] A. Gaier, A. Asteroth, and J. Mouret (2018) Data-efficient design exploration through surrogate-assisted illumination. Evolutionary computation 26 (3), pp. 381–410. Cited by: §1.
  • [23] A. Gaier, A. Asteroth, and J. Mouret (2020) Discovering representations for black-box optimization. In Proceedings of the 2020 Genetic and Evolutionary Computation Conference, GECCO ’20, New York, NY, USA, pp. 103–111. External Links: ISBN 9781450371285, Link, Document Cited by: §3.2.1.
  • [24] X. Glorot and Y. Bengio (2010-13–15 May) Understanding the difficulty of training deep feedforward neural networks. In Proceedings of the Thirteenth International Conference on Artificial Intelligence and Statistics, Y. W. Teh and M. Titterington (Eds.), Proceedings of Machine Learning Research, Vol. 9, Chia Laguna Resort, Sardinia, Italy, pp. 249–256. External Links: Link Cited by: §5.1.2.
  • [25] D. Gravina, A. Khalifa, A. Liapis, J. Togelius, and G. N. Yannakakis (2019) Procedural content generation through quality diversity. In 2019 IEEE Conference on Games (CoG), pp. 1–8. Cited by: §1.
  • [26] D. Ha (2017) A visual guide to evolution strategies. blog.otoro.net. External Links: Link Cited by: §3.1.1.
  • [27] T. Haarnoja, A. Zhou, P. Abbeel, and S. Levine (2018-10–15 Jul) Soft actor-critic: off-policy maximum entropy deep reinforcement learning with a stochastic actor. In Proceedings of the 35th International Conference on Machine Learning, J. Dy and A. Krause (Eds.), Proceedings of Machine Learning Research, Vol. 80, pp. 1861–1870. External Links: Link Cited by: §4.1.1.
  • [28] N. Hansen (2016) The CMA evolution strategy: A tutorial. CoRR abs/1604.00772. External Links: Link, 1604.00772 Cited by: §3.2.1.
  • [29] A. Irpan (2018) Deep reinforcement learning doesn’t work yet. Note: https://www.alexirpan.com/2018/02/14/rl-hard.html Cited by: §1.
  • [30] S. Khadka, S. Majumdar, T. Nassar, Z. Dwiel, E. Tumer, S. Miret, Y. Liu, and K. Tumer (2019-09–15 Jun) Collaborative evolutionary reinforcement learning. In Proceedings of the 36th International Conference on Machine Learning, K. Chaudhuri and R. Salakhutdinov (Eds.), Proceedings of Machine Learning Research, Vol. 97, pp. 3341–3350. External Links: Link Cited by: §3.3.
  • [31] S. Khadka and K. Tumer (2018) Evolution-guided policy gradient in reinforcement learning. In Advances in Neural Information Processing Systems, S. Bengio, H. Wallach, H. Larochelle, K. Grauman, N. Cesa-Bianchi, and R. Garnett (Eds.), Vol. 31, pp. . External Links: Link Cited by: §3.3.
  • [32] D. P. Kingma and J. Ba (2015) Adam: A method for stochastic optimization. In 3rd International Conference on Learning Representations, ICLR 2015, San Diego, CA, USA, May 7-9, 2015, Conference Track Proceedings, Y. Bengio and Y. LeCun (Eds.), External Links: Link Cited by: §3.1.1.
  • [33] S. Kumar, A. Kumar, S. Levine, and C. Finn (2020) One solution is not all you need: few-shot extrapolation via structured maxent rl. Advances in Neural Information Processing Systems 33. Cited by: §3.3.
  • [34] J. Lehman, J. Chen, J. Clune, and K. O. Stanley (2018) ES is more than just a traditional finite-difference approximator. In Proceedings of the Genetic and Evolutionary Computation Conference, GECCO ’18, New York, NY, USA, pp. 450–457. External Links: ISBN 9781450356183, Link, Document Cited by: §4.1.1.
  • [35] J. Lehman and K. O. Stanley (2011-06) Abandoning Objectives: Evolution Through the Search for Novelty Alone. Evolutionary Computation 19 (2), pp. 189–223. External Links: ISSN 1063-6560, Document, Link, https://direct.mit.edu/evco/article-pdf/19/2/189/1494066/evco_a_00025.pdf Cited by: §3.2.3.
  • [36] J. Lehman and K. O. Stanley (2011) Evolving a diversity of virtual creatures through novelty search and local competition. In Proceedings of the 13th Annual Conference on Genetic and Evolutionary Computation, GECCO ’11, New York, NY, USA, pp. 211–218. External Links: ISBN 9781450305570, Link, Document Cited by: §3.2.3.
  • [37] Y. Li, J. Song, and S. Ermon (2017) InfoGAIL: interpretable imitation learning from visual demonstrations. In Advances in Neural Information Processing Systems, I. Guyon, U. V. Luxburg, S. Bengio, H. Wallach, R. Fergus, S. Vishwanathan, and R. Garnett (Eds.), Vol. 30, pp. . External Links: Link Cited by: §3.3.
  • [38] T. P. Lillicrap, J. J. Hunt, A. Pritzel, N. Heess, T. Erez, Y. Tassa, D. Silver, and D. Wierstra (2016) Continuous control with deep reinforcement learning. In 4th International Conference on Learning Representations, ICLR 2016, San Juan, Puerto Rico, May 2-4, 2016, Conference Track Proceedings, Y. Bengio and Y. LeCun (Eds.), External Links: Link Cited by: §1.
  • [39] H. Mania, A. Guy, and B. Recht (2018) Simple random search of static linear policies is competitive for reinforcement learning. In Proceedings of the 32nd International Conference on Neural Information Processing Systems, NIPS’18, Red Hook, NY, USA, pp. 1805–1814. Cited by: §1.
  • [40] J. Mouret and J. Clune (2015) Illuminating search spaces by mapping elites. CoRR abs/1504.04909. External Links: Link, 1504.04909 Cited by: §1, §2.1, §3.2.1.
  • [41] A. Y. Ng, D. Harada, and S. J. Russell (1999) Policy invariance under reward transformations: theory and application to reward shaping. In Proceedings of the Sixteenth International Conference on Machine Learning, ICML ’99, San Francisco, CA, USA, pp. 278–287. External Links: ISBN 1558606122 Cited by: §5.1.1.
  • [42] O. Nilsson and A. Cully (2021) Policy gradient assisted map-elites. In Proceedings of the Genetic and Evolutionary Computation Conference, GECCO ’21, New York, NY, USA, pp. 866–875. External Links: ISBN 9781450383509, Link, Document Cited by: Appendix D, §1, §3.2.1.
  • [43] O. Nilsson (2021) QDgym. GitHub. Note: https://github.com/ollenilsson19/QDgym Cited by: §1, §3.2.1, Figure 4, §5.1.1.
  • [44] OpenAI, I. Akkaya, M. Andrychowicz, M. Chociej, M. Litwin, B. McGrew, A. Petron, A. Paino, M. Plappert, G. Powell, R. Ribas, J. Schneider, N. Tezak, J. Tworek, P. Welinder, L. Weng, Q. Yuan, W. Zaremba, and L. Zhang (2019) Solving rubik’s cube with a robot hand. arXiv preprint. Cited by: §1.
  • [45] P. Pagliuca, N. Milano, and S. Nolfi (2020) Efficacy of modern neuro-evolutionary strategies for continuous control optimization. Frontiers in Robotics and AI 7, pp. 98. External Links: Link, Document, ISSN 2296-9144 Cited by: §4.1.1, §5.2, §6.2.5, §6.2.5.
  • [46] J. Parker-Holder, A. Pacchiano, K. M. Choromanski, and S. J. Roberts (2020) Effective diversity in population based reinforcement learning. In Advances in Neural Information Processing Systems, H. Larochelle, M. Ranzato, R. Hadsell, M. F. Balcan, and H. Lin (Eds.), Vol. 33, pp. 18050–18062. External Links: Link Cited by: §3.2.3.
  • [47] X. B. Peng, M. Andrychowicz, W. Zaremba, and P. Abbeel (2018) Sim-to-real transfer of robotic control with dynamics randomization. In 2018 IEEE International Conference on Robotics and Automation (ICRA), Vol. , pp. 3803–3810. External Links: Document Cited by: §1.
  • [48] Pourchot and Sigaud (2019) CEM-RL: combining evolutionary and gradient-based methods for policy search. In International Conference on Learning Representations, External Links: Link Cited by: §3.3.
  • [49] J. K. Pugh, L. B. Soros, and K. O. Stanley (2016) Quality diversity: a new frontier for evolutionary computation. Frontiers in Robotics and AI 3, pp. 40. External Links: Link, Document, ISSN 2296-9144 Cited by: §1, §5.1.3.
  • [50] N. Rakicevic, A. Cully, and P. Kormushev (2021) Policy manifold search: exploring the manifold hypothesis for diversity-based neuroevolution. In Proceedings of the Genetic and Evolutionary Computation Conference, GECCO ’21, New York, NY, USA, pp. 901–909. External Links: ISBN 9781450383509, Link, Document Cited by: §3.2.1.
  • [51] T. Salimans, J. Ho, X. Chen, S. Sidor, and I. Sutskever (2017) Evolution strategies as a scalable alternative to reinforcement learning. External Links: 1703.03864 Cited by: §1, §3.1.1, §4.1.1.
  • [52] T. Schaul, D. Horgan, K. Gregor, and D. Silver (2015-07–09 Jul) Universal value function approximators. In Proceedings of the 32nd International Conference on Machine Learning, F. Bach and D. Blei (Eds.), Proceedings of Machine Learning Research, Vol. 37, Lille, France, pp. 1312–1320. External Links: Link Cited by: §3.3.
  • [53] J. Schulman, S. Levine, P. Abbeel, M. Jordan, and P. Moritz (2015-07–09 Jul) Trust region policy optimization. In Proceedings of the 32nd International Conference on Machine Learning, F. Bach and D. Blei (Eds.), Proceedings of Machine Learning Research, Vol. 37, Lille, France, pp. 1889–1897. External Links: Link Cited by: §1, §4.1.1.
  • [54] J. Schulman, F. Wolski, P. Dhariwal, A. Radford, and O. Klimov (2017) Proximal policy optimization algorithms. CoRR abs/1707.06347. External Links: Link, 1707.06347 Cited by: §1, §4.1.1, §6.2.5.
  • [55] R. S. Sutton and A. G. Barto (2018) Reinforcement learning: an introduction. Second edition, The MIT Press. External Links: Link Cited by: §2.2.
  • [56] Y. Tang (2021) Guiding evolutionary strategies with off-policy actor-critic. In Proceedings of the 20th International Conference on Autonomous Agents and MultiAgent Systems, AAMAS ’21, Richland, SC, pp. 1317–1325. External Links: ISBN 9781450383073 Cited by: §3.3.
  • [57] B. Tjanaka, M. C. Fontaine, Y. Zhang, S. Sommerer, N. Dennler, and S. Nikolaidis (2021) Pyribs: a bare-bones python library for quality diversity optimization. GitHub. Note: https://github.com/icaros-usc/pyribs Cited by: §5.3.
  • [58] J. Tobin, R. Fong, A. Ray, J. Schneider, W. Zaremba, and P. Abbeel (2017) Domain randomization for transferring deep neural networks from simulation to the real world. In 2017 IEEE/RSJ International Conference on Intelligent Robots and Systems (IROS), Vol. , pp. 23–30. External Links: Document Cited by: §1.
  • [59] V. Vassiliades and J. Mouret (2018) Discovering the elite hypervolume by leveraging interspecies correlation. In Proceedings of the Genetic and Evolutionary Computation Conference, GECCO ’18, New York, NY, USA, pp. 149–156. External Links: ISBN 9781450356183, Link, Document Cited by: Appendix D, §3.2.1.
  • [60] D. Wierstra, T. Schaul, T. Glasmachers, Y. Sun, J. Peters, and J. Schmidhuber (2014) Natural evolution strategies. Journal of Machine Learning Research 15 (27), pp. 949–980. External Links: Link Cited by: §1, §3.1.1, §3.1.1.
  • [61] D. Wierstra, T. Schaul, J. Peters, and J. Schmidhuber (2008) Natural evolution strategies. In 2008 IEEE Congress on Evolutionary Computation (IEEE World Congress on Computational Intelligence), Vol. , pp. 3381–3387. External Links: Document Cited by: §3.1.1.